
Data Analytics Training & Placemnet In Chennai
Looking to build a career in Data Analytics? Our Data Analytics Training & Placement program in Chennai is designed to equip you with industry-relevant skills and hands-on experience. Learn key tools like Excel, SQL, Python, Power BI, and Tableau, and gain expertise in data visualization, statistical analysis, and business intelligence. With expert-led training, real-time projects, and dedicated placement support, we ensure you are job-ready for top roles in the industry.
Technologies You Will Learn



Greens Technologies
Popular Courses
Master Data Analytics with hands-on training and real-world projects. Gain industry-relevant skills and secure top placements with expert guidance.
Course 1
POWER BI + POWER BI SERVICE + SQL
-
30+ Hours + Placement Training -
Live Projects & Assesments -
Assured Placements -
Offline | Online
Course 2
POWER BI + POWER BI SERVICE + SQL + PYTHON
-
40+ Hours + Placement Training -
Live Projects & Assesments -
Assured Placements -
Offline | Online
Course 3
TAB + TAB SERVER + PBI + PBI SERVER + SQL + PYTHON
-
45+ Hours + Placement Training -
Live Projects & Assesments -
Assured Placements -
Offline | Online
Course 4
TABLEAU + TABLEAU SERVER + SQL
-
30+ Hours + Placement Training -
Live Projects & Assesments -
Assured Placements -
Offline | Online
Course 5
TABLEAU + TABLEAU SERVER + SQL+PYT
-
35+ Hours + Placement Training -
Live Projects & Assesments -
Assured Placements -
Offline | Online
Course 6
PBI + PBI SERVER + TAB + TAB SERVER + PYTHON
-
40+ Hours + Placement Training -
Live Projects & Assesments -
Assured Placements -
Offline | Online
Curriculum
Power BI Syllabus
Introduction & Setup
- Overview of Power BI and its capabilities
- Installation and configuration of the software
Data Fundamentals
- Understanding various data types and structures
- Key principles of data modeling
DAX Functions
- Aggregation: SUM, AVERAGE, COUNT
- Date & Time: TODAY, YEAR, DATEADD
- Logical Operations: IF, AND, OR, NOT
- Filtering: FILTER, ALL
- Statistical Measures: MAX, MIN, MEDIAN
- Text Functions: CONCATENATE, LEFT, RIGHT, MID
- Information Functions: COLUMNNAME, COLUMNS, DATATABLE, ISBLANK, ISCOLUMN, ISERROR, ISEMPTY
Time Intelligence Functions
- Advanced date-based calculations for data analysis
Power Query & Data Processing
- Connecting to diverse data sources, including files and databases
- Transforming data: renaming, modifying types, handling duplicates, filtering, sorting, merging, pivoting, and unpivoting
- Effective error management and data processing optimization
Data Structuring & Extraction
- Organizing and managing dataset columns
- Splitting, selecting, and performing join operations on data
- Appending, duplicating, merging queries, and building dimension tables
Data Visualization & Dashboarding
- Designing interactive dashboards with customized formatting
- Integrating Power BI with cloud platforms for seamless reporting
Tableau Syllabus
- Introduction to Tableau: Learn about the interface, available products, and essential desktop features.
- Understanding Data Types: Explore different data types and their significance in visualization.
- Data Connections: Discover various connection types for seamless data integration.
- Dimensions & Measures: Learn to differentiate and utilize dimensions and measures effectively.
- Discrete vs. Continuous Data: Understand their concepts and applications in Tableau.
- File Extensions in Tableau: Get insights into supported file types and their functions.
- Advanced Data Grouping: Work with groups, sets, parameters, hierarchies, and combined sets.
- Filtering Techniques: Implement data source, extract, dimension, measure, cascading, and context filters.
- Tableau Functions: Explore numerical, aggregate, logical, string, date functions, table calculations, and analytics.
- Level of Detail (LOD) & Bins: Learn about LOD expressions and data binning techniques.
- Axes & Charts: Master different chart types and axis configurations.
- Maps & Filters: Implement interactive mapping and filtering methods.
- Dashboard Development: Build interactive and engaging dashboards.
- Dashboard Actions: Configure actions for enhanced interactivity.
- Data Modeling: Understand relationships, joins, and data blending.
- Joins & Cross-Database Joins: Learn to work with joins across databases.
- Tableau Server & Tableau Online: Introduction to deployment, publishing, and management.
- Embedded & Published Data Sources: Work with various data source configurations.
- User Access & Security: Manage roles, access controls, and row-level security (RLS).
- Alerts, Subscriptions & Metrics: Set up notifications, scheduled reports, and performance tracking.
- Handling Extract Issues: Troubleshoot data extraction problems, including empty extracts.
SQL Syllabus
- Introduction and Fundamentals
- Setup and Installation
- Building Databases and Tables
- Exploring Different Data Types
- Effective Use of Operators
- Text Formatting Functions (UPPER(), LOWER(), INITCAP())
- String Handling Functions (SUBSTRING(), CONCAT(), LEN(), TRIM(), REPLACE())
- Essential Functions (Date, Null Handling, Numeric, General)
- Aggregation and Grouping (COUNT(), SUM(), AVG(), MIN(), MAX(), GROUP BY, HAVING)
- Analytical and Window Functions
- SQL Commands (DDL, DML, TCL, DQL)
- Joins and Relationships (INNER, LEFT, RIGHT, FULL, CROSS)
- Data Integrity and Constraints (NOT NULL, PRIMARY KEY, UNIQUE, FOREIGN KEY, DEFAULT, INDEX, CHECK)
- Set Operators (UNION, UNION ALL, MINUS, INTERSECT)
- Views and Materialized Views
- Subqueries and Nested Queries
- Special and Pseudo Columns (ROWID, ROWNUM, LEVEL, CONNECT_BY_ISLEAF, SYS_GUID())
Python Syllabus
Introduction
- Setting up the environment and installation
- Installing Python, Anaconda, and Jupyter Notebook
Programming Fundamentals
- Understanding the difference between compilation and interpretation
- Writing your first Python script
- Creating a “Hello World” program
Core Python Concepts
- Working with variables and assignments
- Exploring different data types and their applications
- Performing computations using operators
Control Flow & Functions
- Implementing conditional statements: if, if-else, elif
- Using loops: for loop, while loop
- Defining functions and utilizing built-in methods
Data Structures & Iteration Tools
- Understanding lists, tuples, sets, and dictionaries
- Using iteration tools like map and filter
Advanced Python Topics
- Implementing regular expressions
- Managing modules, packages, and PIP
Error Handling & Object-Oriented Programming
- Handling exceptions effectively
- Understanding OOP concepts: classes, objects, constructors, and attributes
- Exploring inheritance, encapsulation, and polymorphism
Additional Python Features
- Working with lambda (anonymous) functions
- Utilizing essential Python libraries like NumPy, Pandas, and Matplotlib
- Understanding generators and closures
Power Automate Syllabus
- Send automated emails to Gmail with file attachments from OneDrive.
- Generate new groups dynamically using Microsoft Forms.
- Schedule automated greeting emails for birthdays and weddings.
- Set up Power BI alerts for notifications in Microsoft Teams and Outlook.
- Automate dataset refresh operations seamlessly.
- Utilize aggregate and grouping functions like COUNT(), SUM(), AVG(), MIN(), MAX(), GROUP BY, and HAVING.
Power Apps Syllabus
Introduction
Begin your journey by setting up a seamless development environment and configuring essential tools.
Fundamental Concepts
Learn about variables, data structures, and managing collections, including creation, access, modification, iteration, and cleanup.
Application Development
Automate tasks like email generation for birthdays and key events while exploring Canvas and Model-Driven Apps. Work with data sources, controls, expressions, and screens for dynamic applications.
Seamless Data Integration & User Interaction
Utilize formulas, variables, and contextual data to enhance app functionality. Handle user inputs effectively with interactive elements.
Functions & Expressions
Understand key functions related to data, control, math, text, logic, and date/time operations. Use expressions like OnSelect, OnClick, Launch, and Navigation for dynamic responses.
Advanced Development Techniques
Build Canvas Apps integrated with SQL and SharePoint, implement data validation, design interactive forms and galleries, and perform CRUD operations.
Power BI Integration
Seamlessly connect Power BI with Power Apps, design interactive reports, generate embed codes, and configure dynamic features for an enhanced user experience.
Testing, Deployment & Implementation
Ensure a smooth launch by thoroughly testing, deploying, and finalizing app functionality for optimal performance.
Introduction & Setup
- Overview of Power BI and its capabilities
- Installation and configuration of the software
Data Fundamentals
- Understanding various data types and structures
- Key principles of data modeling
DAX Functions
- Aggregation: SUM, AVERAGE, COUNT
- Date & Time: TODAY, YEAR, DATEADD
- Logical Operations: IF, AND, OR, NOT
- Filtering: FILTER, ALL
- Statistical Measures: MAX, MIN, MEDIAN
- Text Functions: CONCATENATE, LEFT, RIGHT, MID
- Information Functions: COLUMNNAME, COLUMNS, DATATABLE, ISBLANK, ISCOLUMN, ISERROR, ISEMPTY
Time Intelligence Functions
- Advanced date-based calculations for data analysis
Power Query & Data Processing
- Connecting to diverse data sources, including files and databases
- Transforming data: renaming, modifying types, handling duplicates, filtering, sorting, merging, pivoting, and unpivoting
- Effective error management and data processing optimization
Data Structuring & Extraction
- Organizing and managing dataset columns
- Splitting, selecting, and performing join operations on data
- Appending, duplicating, merging queries, and building dimension tables
Data Visualization & Dashboarding
- Designing interactive dashboards with customized formatting
- Integrating Power BI with cloud platforms for seamless reporting
- Introduction to Tableau: Learn about the interface, available products, and essential desktop features.
- Understanding Data Types: Explore different data types and their significance in visualization.
- Data Connections: Discover various connection types for seamless data integration.
- Dimensions & Measures: Learn to differentiate and utilize dimensions and measures effectively.
- Discrete vs. Continuous Data: Understand their concepts and applications in Tableau.
- File Extensions in Tableau: Get insights into supported file types and their functions.
- Advanced Data Grouping: Work with groups, sets, parameters, hierarchies, and combined sets.
- Filtering Techniques: Implement data source, extract, dimension, measure, cascading, and context filters.
- Tableau Functions: Explore numerical, aggregate, logical, string, date functions, table calculations, and analytics.
- Level of Detail (LOD) & Bins: Learn about LOD expressions and data binning techniques.
- Axes & Charts: Master different chart types and axis configurations.
- Maps & Filters: Implement interactive mapping and filtering methods.
- Dashboard Development: Build interactive and engaging dashboards.
- Dashboard Actions: Configure actions for enhanced interactivity.
- Data Modeling: Understand relationships, joins, and data blending.
- Joins & Cross-Database Joins: Learn to work with joins across databases.
- Tableau Server & Tableau Online: Introduction to deployment, publishing, and management.
- Embedded & Published Data Sources: Work with various data source configurations.
- User Access & Security: Manage roles, access controls, and row-level security (RLS).
- Alerts, Subscriptions & Metrics: Set up notifications, scheduled reports, and performance tracking.
- Handling Extract Issues: Troubleshoot data extraction problems, including empty extracts.
- Introduction and Fundamentals
- Setup and Installation
- Building Databases and Tables
- Exploring Different Data Types
- Effective Use of Operators
- Text Formatting Functions (UPPER(), LOWER(), INITCAP())
- String Handling Functions (SUBSTRING(), CONCAT(), LEN(), TRIM(), REPLACE())
- Essential Functions (Date, Null Handling, Numeric, General)
- Aggregation and Grouping (COUNT(), SUM(), AVG(), MIN(), MAX(), GROUP BY, HAVING)
- Analytical and Window Functions
- SQL Commands (DDL, DML, TCL, DQL)
- Joins and Relationships (INNER, LEFT, RIGHT, FULL, CROSS)
- Data Integrity and Constraints (NOT NULL, PRIMARY KEY, UNIQUE, FOREIGN KEY, DEFAULT, INDEX, CHECK)
- Set Operators (UNION, UNION ALL, MINUS, INTERSECT)
- Views and Materialized Views
- Subqueries and Nested Queries
- Special and Pseudo Columns (ROWID, ROWNUM, LEVEL, CONNECT_BY_ISLEAF, SYS_GUID())
Introduction
- Setting up the environment and installation
- Installing Python, Anaconda, and Jupyter Notebook
Programming Fundamentals
- Understanding the difference between compilation and interpretation
- Writing your first Python script
- Creating a “Hello World” program
Core Python Concepts
- Working with variables and assignments
- Exploring different data types and their applications
- Performing computations using operators
Control Flow & Functions
- Implementing conditional statements: if, if-else, elif
- Using loops: for loop, while loop
- Defining functions and utilizing built-in methods
Data Structures & Iteration Tools
- Understanding lists, tuples, sets, and dictionaries
- Using iteration tools like map and filter
Advanced Python Topics
- Implementing regular expressions
- Managing modules, packages, and PIP
Error Handling & Object-Oriented Programming
- Handling exceptions effectively
- Understanding OOP concepts: classes, objects, constructors, and attributes
- Exploring inheritance, encapsulation, and polymorphism
Additional Python Features
- Working with lambda (anonymous) functions
- Utilizing essential Python libraries like NumPy, Pandas, and Matplotlib
- Understanding generators and closures
- Send automated emails to Gmail with file attachments from OneDrive.
- Generate new groups dynamically using Microsoft Forms.
- Schedule automated greeting emails for birthdays and weddings.
- Set up Power BI alerts for notifications in Microsoft Teams and Outlook.
- Automate dataset refresh operations seamlessly.
- Utilize aggregate and grouping functions like COUNT(), SUM(), AVG(), MIN(), MAX(), GROUP BY, and HAVING.
Introduction
Begin your journey by setting up a seamless development environment and configuring essential tools.
Fundamental Concepts
Learn about variables, data structures, and managing collections, including creation, access, modification, iteration, and cleanup.
Application Development
Automate tasks like email generation for birthdays and key events while exploring Canvas and Model-Driven Apps. Work with data sources, controls, expressions, and screens for dynamic applications.
Seamless Data Integration & User Interaction
Utilize formulas, variables, and contextual data to enhance app functionality. Handle user inputs effectively with interactive elements.
Functions & Expressions
Understand key functions related to data, control, math, text, logic, and date/time operations. Use expressions like OnSelect, OnClick, Launch, and Navigation for dynamic responses.
Advanced Development Techniques
Build Canvas Apps integrated with SQL and SharePoint, implement data validation, design interactive forms and galleries, and perform CRUD operations.
Power BI Integration
Seamlessly connect Power BI with Power Apps, design interactive reports, generate embed codes, and configure dynamic features for an enhanced user experience.
Testing, Deployment & Implementation
Ensure a smooth launch by thoroughly testing, deploying, and finalizing app functionality for optimal performance.
Experience
Gain hands-on experience with real-world data analytics projects, guided by industry experts. Our training ensures you master key skills and secure top placements in leading companies.
Education
Master Data Analytics with expert-led training and hands-on projects. Secure top placements with our industry-focused guidance.
Certificate
Earn your Data Analytics Certification from Greens Technology and boost your career prospects. Our industry-recognized certification validates your expertise and enhances job opportunities.
Our Data Analytics Training
Take your data skills to the next level with our Data Analytics Training.
Greens Technologies
Course Options:
One-on-One Mentoring
Get personalized guidance with our One-on-One Mentoring in Data Analytics training. Our experts provide tailored support to help you master skills and secure top placements.
Hybrid Learning
Our Hybrid Learning approach offers the flexibility of both online and in-person sessions, ensuring you gain hands-on experience in Data Analytics while balancing your schedule. With expert-led training and real-world projects, you’ll be job-ready with placement support from Greens Technology.
Online Learning
Master Data Analytics with our comprehensive online training program. Gain in-demand skills and secure top placements with expert guidance.
Fast-Track Courses
Accelerate your career with our Fast-Track Data Analytics Training & Placement program. Gain industry-relevant skills quickly and secure job opportunities with expert guidance.
Data Speaks Louder Than Words
Students Enrolled
0
+
Branches
0
Placed Students
0
+
Years Of Experience
0
Features of Our Data Analytics Training & Placement
Expert-Led Training
Learn from industry-experienced professionals.
Hands-On Projects
Work on real-world data analytics tasks.
Certification Support
Get assistance for top industry certifications.
Job Assistance
Dedicated support for resume and interview prep.
Flexible Learning
Choose classroom or online training options.
Live Case Studies
Analyze real industry datasets and trends.
Advanced Tools
Master Python, SQL, Excel, and Power BI.
One-on-One Mentorship
Personalized guidance from analytics experts.
Practical Experience
Work on live industry projects hands-on.
Lifetime Access
Revisit course materials anytime for revisions.
Student Hub
Model Resume
Model Resume Download Links
Software Links
Software Download Links
SQL Compiler
Check Out Our SQL Compiler!
Greens Technology offers a powerful online SQL Compiler to help you practice and improve your SQL skills. Click the button below to get started.
Job Portals
Job Portals list
- Data Analytics Jobs on Naukri
- Data Analytics Jobs on Indeed
- Data Analytics Jobs on LinkedIn
- Data Analyst Jobs on Shine
- Data Analyst Jobs on Foundit
- Data Analyst Jobs on TimesJobs
- Data Analyst Jobs on Glassdoor
- Data Analyst Jobs on Freshersworld
- Data Analyst Freelance Jobs on Upwork
- Data Analyst Jobs on HerKey
- Data Analyst Jobs on Cutshort
- Data Analyst Jobs on Jobsora
- Data Analyst Jobs on Quikr
- Data Analyst Jobs on Hirist
- Data Analyst Jobs on Snaphunt
- Data Analyst Jobs on WorkIndia
- Data Analyst Jobs on Foundit (Alternate)
- Data Analyst Jobs on Fishbowl
- Data Analyst Jobs on Wellfound
Tableau Class Task
Task 1: Introduction
- Visualize region-wise sales using a pie chart with tooltips showing profit and discounts.
- Represent date-wise sales through a line chart.
- Design a distinctive chart to display sales by category and sub-category.
- Create a treemap using Region and Discount as key metrics.
- Develop a bubble chart showcasing Subcategory and Profit.
- Analyze state-wise sales using a box-and-whisker plot.
- Generate 24 charts utilizing custom metrics from the “Show Me” panel.
Task 2: Level of Detail (LOD)
- Identify the last order date for each product.
- Determine the most recent purchase for each customer.
- Visualize total sales at the sub-category level using Category, Sub-Category, State, and Sales.
- Classify product count based on defined sales ranges (0–1000).
Task 3: Analytics & Quick Table Calculations
- Forecast sales trends for 2021.
- Compare actual sales against a chosen target value.
- Cluster sub-categories based on data trends.
- Create a text-based chart incorporating Region, Segment, Category, Sub-Category, and Sales with row and sub-totals.
- Develop a bar chart to display average sales by Region.
- Calculate cumulative sales for each customer.
- Determine the sales difference between previous and current values at the sub-category level.
Task 4: Dual/Blended/Sync Filters
- Design a single visualization incorporating Sales, Discount, Profit, and Category.
- Compare current-year profit and sales within one chart.
- Implement a context filter for Category and Sub-Category.
- Set up a cascading filter for Category and Sub-Category.
Task 5: Grouping, Sets, Parameters, and Hierarchies
- Identify top-performing products based on Profit and Product.
- Display the top and bottom five sub-categories by sales.
- Enable multiple graphs on a single sheet using metrics such as Profit, Total Sales, and Profit Ratio.
- Implement drill-down functionality for all product-related fields.
- Develop a grouped and combined visualization using a customized approach.
- Create a date parameter using Ship Date to reflect across all charts.
Task 6: Functions
- Show the last date of the current month.
- Calculate remaining days until the year’s end.
- Identify the most recent purchase date for each customer.
- Count total records per sub-category.
- Convert “appliances” to “Appliances” (capitalize first letter).
- Display total sales for each category.
- Count sales per category while excluding duplicates.
- Retrieve the second order date for each customer.
- List all customers whose names begin with “A.”
- Identify customers whose names end with “H.”
- Extract the year from the Order ID.
- Categorize sales into three ranges:
- Above 50,000: Good
- Above 100,000: Very Good
- Above 150,000: Excellent
Task 7: Dashboard Creation
Key Performance Indicators (KPIs):
- Sales
- Profit
- Sales per Customer
- Profit per Product
- Sales Growth Compared to the Previous Year
Dashboard Components:
- Include two filters and a date parameter.
- Incorporate at least six charts:
- Year-over-Year (YOY) Analysis
- Four custom-designed charts
- One tailored visualization
- One map-based chart
- Enable action filters for interactive data analysis.
Weekend Task 01: Custom Charts
- Waterfall Chart
- Donut Chart
- Butterfly Chart
- Pyramid/Funnel Chart
- Histogram Chart
- Heat Map and Treemap using Profit and Sales
Weekend Task 02: Dashboard Development
- Source data from Tableau Public and build a detailed dashboard.
- Apply two filters and a date parameter for dynamic interaction.
Tableau Limitations
- Maximum Rows: Unlimited
- Maximum Columns: 50
- Maximum Table Joins: 32
- Default Join Type: Inner Join (modifiable)
- Blended Data Join: Left Outer Join by default
- Maximum Worksheets: 155
- Maximum Parameters: 155
Power BI Class Task
Power Query
- Efficient data transformation and connectivity.
Data Visualization & Power BI Desktop
- Create dynamic reports and dashboards.
M Query
- Automate and optimize data processing.
Power Query Editor
- Extract, transform, and load (ETL) data efficiently.
Data Modeling
- Build structured relationships for insightful analysis.
DAX Functions
- Perform advanced calculations and aggregations.
Power BI Visuals
- Enhance reports with interactive charts and graphs.
Power BI Service
- Publish, share, and collaborate on reports online.
Report Views
- Customize layouts for better data presentation.
Data View
- Explore raw data in structured format.
Model View
- Manage relationships between multiple datasets.
Transform Data
- Modify and optimize existing data structures.
Add Column
- Create customized columns for analysis.
Transformation Options
- Various tools for reshaping and organizing data.
Data Types
- Supports numeric, text, date, and Boolean formats.
Data Operations
- Perform header adjustments, transpositions, and modifications.
Formatting Options
- Change case, trim, merge, and parse data.
Statistical Functions
- Calculate sum, average, median, and deviations.
Mathematical & Scientific Functions
- Perform standard and advanced calculations.
Standard Calculations
- Execute addition, subtraction, and percentage functions.
Scientific Operations
- Compute power, logarithm, and square root values.
Rounding Functions
- Round up, down, or to the nearest value.
Date & Time Functions
- Extract and manipulate date and time components.
Column Operations
- Create custom, conditional, and indexed columns.
Data Management & Queries
- Manage data connections and refresh data.
Home Functions
- Sort, filter, remove, and group data efficiently.
Merging & Appending Queries
- Merge and append datasets using various joins.
DAX – Data Analytics Expressions
- Perform complex calculations with optimized performance.
Calculated Columns & Measures
- Create memory-efficient calculations and aggregations.
Date & Logical Functions
- Apply conditional logic and date-based calculations.
Text Functions
- Format and manipulate text data effectively.
Time Intelligence Functions
- Analyze trends with YTD, QTD, and MTD calculations.
Information & Aggregate Functions
- Validate data and perform filtering operations.
Power BI Service
- Publish, share, and refresh reports seamlessly.
SQL Class Task
SQL Tasks – Hands-On Practice
Day 1: Filtering and Sorting Data
- Retrieve names beginning with ‘S’.
- Find names starting with ‘S’ and ending with ‘n’.
- List employees in department 90 whose names start with ‘S’.
- Display employees from departments 10, 20, 50, and 90.
- Retrieve names, salaries, and department IDs outside these departments.
- Find employees with salaries between 5000 and 7000.
- List employees without managers.
- Retrieve all employee records sorted by first name.
- Display department ID and salary, sorted by department (asc) and salary (desc).
- Find employees earning more than $12,000.
- Retrieve last name and department number for employee ID 176.
- Show employees hired between Feb 20, 2003, and May 1, 2005.
- List employees from departments 20 and 50 in alphabetical order.
- Show job titles of employees without managers.
- Display salary and commission details for employees receiving commissions.
Day 2: Aggregate Functions
- Count total employees.
- Calculate the average salary.
- Identify highest and lowest salaries.
- Determine the average salary per department.
- Find departments with more than 5 employees.
- Compute the average salary for those earning above $50,000.
- Calculate total salary expense per department.
- Count employee hires per year, month, and weekday.
- Count employees with the same job title.
- Display max, min, sum, and average salaries.
- Find salary statistics per job type.
- Compute the difference between highest and lowest salaries.
- Count total managers.
Day 3: Analytical vs. Aggregate Functions
- Compute the organization’s average salary.
- Calculate department-wise average salary.
- Show average salary alongside each employee.
- Find cumulative salary per department and company-wide.
- Rank employee salaries within departments.
- Identify the highest and lowest salaries per department.
- Find oldest and newest employees per department.
Day 4: Date Functions
- Retrieve the current date and time.
- Extract year, month, and day from a date.
- Calculate the difference between two dates in days.
- Format dates in SQL Server.
- Add and subtract days from a date.
- Identify the first and last day of the current month.
- Extract the quarter of the year from a date.
- Determine the number of weeks between two dates.
- Compute hours, minutes, and seconds between two timestamps.
Day 5: String Functions
- Extract first names from full names.
- Convert employee names to uppercase.
- Retrieve employees with names starting with ‘J’.
- Concatenate first and last names.
- Format phone numbers with dashes.
- Find employees with specific email domains.
- Identify last names with exactly five characters.
- Extract the domain from email addresses.
- Replace specific characters in strings.
- Reverse characters in last names.
Day 6: Case & Convert Functions
- Indicate whether employees receive commissions.
- Classify employees based on experience levels.
- Categorize employee salaries as Low, Medium, or High.
- Convert hire dates into various formats.
- Use CASE to label employees by job title.
Day 7: Data Definition Language (DDL)
Creating and Modifying Tables
- Create an Employees table with EmployeeId, FirstName, LastName, HireDate, and Salary.
- Add an EmailAddress column to the Employees table.
- Allow NULL values in the Salary column.
- Rename the LastName column to Surname.
Dropping and Renaming Tables
- Remove the Employees table from the database.
- Rename the Employees table to Staff.
Constraints and Indexes
- Apply a unique constraint to the EmailAddress column.
- Establish a foreign key linking Employees and Departments.
- Retrieve a list of all tables in the database.
- Create a Projects table with ID, ProjectName, StartDate, and Budget.
Day 8: Data Manipulation Language (DML) & Transaction Control Language (TCL)
Data Manipulation
- Insert a new employee with EmployeeId 101.
- Update EmployeeId 101’s salary to 80,000.
- Delete EmployeeId 101 from Employees.
- Assign DepartmentId 5 to employees earning above 70,000.
- Insert multiple records into Projects.
- Fetch all Employees and replace NULL values in EmailAddress.
- Set NULL CommissionPCT values to 0.
- Bulk insert into Projects in a single query.
- Delete Projects with StartDate before 2024-03-01.
- Update EmailAddress for employees with LastName ‘Doe’.
Transactions
- Define transactions and their significance in SQL Server.
- Explain the COMMIT statement.
- Describe the ROLLBACK function.
- Discuss SAVEPOINT and its applications.
- Compare COMMIT, ROLLBACK, and SAVE TRANSACTION.
Power BI Interview Questions
1. What is power query editor?
2. What are the connection present in power bi?
3. What is live connection?
4. What is reference?
5. What is duplicate?
6. What is append and merge?
7. What are the types of joins in power bi?
8. What is query folding?
9. What is m language?
10. What is query dependency?
11. What are the transformation will do in power query editor?
12. What is dimension and measure?
13. What is pivot and unpivot?
14. What is groupbyfunction in power query editor?
15. What is grouping and binning in power bi?
16. What are the most common data shaping technique?
17. What is data modelling
18. What is dimension tableand fact table and also difference?
19. What is star schema, snow flake schema?
20. What is cardinality or relationship?
21. How many cardinality are there in power bi?
22. What relationship?
23. How to implement relationship?
24. How to implement many to many relationship?
25. What bidirectional filter?
26. How many active relationship we can create at a time during modelling?
27. What is report view?
28. What are the refresh in power bi?
29. What is incremental refresh
30. What is full refresh?
31. How to implementation of incremental refresh?
32. What is manage relationship? DATA VISUALISATION QUESTIONS:
33. What is dax functions?
34. What is rls and implementation
35. Types of rls
36. What is new column, new measure,new table?
37. What calculated column, calculated measure?
38. Diff sum between sumx?
39. Diff between row context and filter context?
40. Difff calculateand calculate table?
41. Diff all, all except, all select & real time use case?
42. What are the dax functions you have used?
43. What are the functional groups in dax?
44. What is time intelligence function ?
45. How to connect relation in dax?
46. What is cumulative dax functions
47. Types of filter
48. What is slicer and sync slicer?
49. What is drill down and drill through
50. Diff between filter and slicer
51. What is book mark?
52. What is book mark action?
53. What is custom visuals?
54. Explain what types charts have you used in your projects?
55. Parameter (query parameter, visual parameter)
56. What is performance tuning?
57. What conditional formatting
58. How you testing the reports?
59. Difference between reports and dashboard?
60. How you will get requirement or brd
61. Limitation of import method?
62. Maximum data size used in power bi
63. What is summarize , summarizex?
64. What is iteration function?
65. What is power automate?
66. What are the three fundamental concepts of dax
67. Performance tuning (dax,datamodelling,visual,query editor)
POWER BI SERVICE QUESTIONS:
68. What is alert, subscription
69. What is power bi service?
70. What is gateway connectios and types?
71. What is workspace?
72. What is data flow?
73. What is ccid pipeline?
74. What is switch function?
75. What is subscription and alert?
76. Will you able create multiple workspace?
77. What are the tabs available in power service?
78. What is scd?
79. What is paginated report?
80. How to configure schedule refresh in power bi service? GENERAL QUESTIONS:
81. What is power bi?
82. Difference between power bi and tableau?
83. Why you prefering power bi?
84. Power bi latest version and updates
85. What are the views present in power bi
86. How to get data from data source?
87. What is power q/a?
88. What is power map?
89. What are the components present in power bi?
90. What is ssbi?
91. What are the database have you used?
92. Advantange and limitations of power bi?
93. What data sources can power bi connect to?
94. Where is data stored in power bi?
Data warehousing questions
1. What is data warehousing?
2. Olap vs oltp
3. Star schema and snowflake schema
SQL interview question
1. What are the available data types in SQL?
2. What are the operators we have in SQL?
3. What are the case manipulation functions?
4. What are the character/string manipulation functions?
5. What are the analytical functions in SQL,explain its types?
6. What are the aggregate functions in SQL,explain its types?
7. What are the null functions in SQL and explain its types?
8. What are the date functions in SQL and explain its types?
9. What is ddl, dml & tcl, dql commands?
10. What are the joins available in SQL?
11. What is a view & materialized view?
12. What are the sub queries in SQL?
13. What are the set operations?
14. What are the pseudo columns?
15. What is a like operator?
16. What are the constraints
SQL difference questions
1. What is the difference between where and having?
2. What is the difference between delete, drop & truncate?
3. What is the difference between union and unionall?
4. What is the difference between nvl, nvl2 & colasece?
5. What is the difference b/w primary key & foreign key?
6. What is the differences between in and equall to?
7. What is the difference between case and decode?
8. What is the difference between and and or?
SQL queries
1. Write query to find max salary from employee table?
2. Write query to find 2nd max salary from employee table?
3. Write query to find nth max salary from employee table?
4. Write query to find max salary department wise?
5. Write query to find nth max salary department wise?
6. Write query to find employee & manager name?
7. Write query to how to find and delete the duplicates?
Tableau Interview Questions
1. What is Tableau, Why it is used for
2. What is data visualization
3. What is Workbook, Worksheet, Dashboard and Story
4. What are the data types in Tableau
5. What is Dimensions and Measures
6. What is Discrete and Continuous
7. What is Aggregation and Disaggregation of data
8. Types of file Extensions in Tableau
9. What is Group and Combine
10. What is Dynamic Group
11. What is Set and Parameter
12. What is Hierarchy and how you will create
13. What are the types of connection in Tableau
14. Types of Filters in Tableau
15. What is Context filter and Cascading Filter
16. Order of Execution of filterM
17. What is Dual Axis, Blended Axis & Synchronizing Axis
18. What are the Analytical Functions in Tableau
19. What are the Dashboard Actions present in Tableau
20. What are the Number Functions in Tableau
21. What are the Aggregate Functions in Tableau
22. What are the logical Functions in Tableau
23. What are the String Functions in Tableau
24. What are the Table calculation Function in Tableau
25. What are the Date Functions in Tableau
26. What is Data Blending
27. What is Data Joining
28. What is Relationship
29. What is LOD and its types
30. What is Bins
31. What are the types of Joins
32. What is Calculated Field
33. What is Quick Table Calculation and types
34. What are Worksheet Marks
35. What are the Dashboard Actions
36. What is Tiled and Floating
37. How to increase Performance in Tableau/Performance Improvement
38. How to overcome unknown location in Tableau
39. What is Published Data Source
40. What is Embedded Data Source
41. What is KPI and What are the KPI’s used in your Project
42. What are the Rank Functions in Tableau
43. How is Context Filter different from other filter? What is the disadvantage of context filter
44. What is Tableau Server
45. What is User filter and Row level Security
46. What is Incremental Refresh
47. What is Tableau Data Engine/hyper
48. Roles available in Tableau Server
49. Limitations of Context Filter
50. What is Data Extract in Tableau Server
51. What is Alert and What is Subscription
52. Performance tuning in Tableau
53. How performance testing done in Tableau
54. What is Normalization and Denormalization
55. What is Granularity
56. What is Boxplot Chart
57. What is Scatter Chart
58. What is Histogram Chart
59. What is Dendogram Chart
60. What is Waterfall Chart
61. What is Referential Integrity
62. What is cardinality
63. What is set and where you have used
64. What is Primary data and Secondary data
65. How will you Change Primary and Secondary Data Source
Difference between Questions
1. Difference b/w twb and twbx
2. Difference b/w Group and Combine
3. Difference b/w Set and Parameter
4. Difference b/w set and Group
5. Difference b/w Heat map and Tree map
6. Difference b/w Context filter and Cascading filter
7. Difference b/w Dual Axis and Blended Axis
8. Difference b/w Ceiling and Floor
9. Difference b/w Ifnull, Isnull and Zn
10. Difference b/w contains and endswith
11. Difference b/w ltrim and rtrim
12. Difference b/w first and last
13. Difference b/w Rank and Rank_dence
14. Difference b/w Today and Now
15. Difference b/w Data blending and Data Joining
16. Difference b/w live and Extract Connection
17. Difference b/w Alert and Subscription
18. Difference b/w Filters and Parameter
Scenario Based Questions
1. How to display top5 and bottom5 sales
2. What are the KPI’s used in your Project
3. What is the version you are using
4. What are the unique features in every version of Tableau
5. How to remove ‘All’ in Show Filters
6. How to display * in measures
7. How many data sources you can blend(5)
8. How many tables you can Join(32)
9. How many columns we can extend in Tableau(50) Default is (16)
10. There are three customer in the super store data set. What percent of the total profits is associated with the corporate segment?
Output:Consumer-46.83%
Corporate-32.12%
Home Office-21.05%
11. How to remove ‘Abc’ from the table
12. What is Empty Extract
13. What Visualization will you suggest for the following Scenarios
i) To Show aggregated sales totals across a range of product categories(Tree map)
ii) To show the duration of events or activities(Gantt Chart)
iii) To show quarter wise profit growth(Waterfall)
14. What are the Special Chart you used in your Project
15. Can we use group in calculated field
16. There is a sale record in which dates are from Monday to Sunday. How can we take records from Wednesday to Sunday
17. Top and bottom value how you will achieve
18. Which chart will you prefer for time line scenario
19. How will you Extract data from server
20. Have you used forecast in your project
21. What is the custom SQL you used in your project
22. How will you neglect null values
23. How to Change Start Date of week and Fiscal Date in the Data
24. How will you find Second Order Date
25. How to display Top20-30
Other Questions
1. What is the Difference Between Tableau and Other BI tools
2. What are the Tableau Products
3. What is ETL and What are the ETL toll you are using
4. For what Tableau Server is used For
5. Do parameter contains a Drop down list
6. Drawbacks of Tableau
7. Drawbacks of data blending
8. What are the documents you will attached to client during deployment
9. What is the default aggregation function
10. What is the default chart
11. How can you embed a webpage in a dashboard
12. How can you Schedule a workbook in Tableau after publishing it
13. What are difficulties faces/difficult Scenarios
14. What is the data source you are using in your project
15. What is data warehousing
16. Have you used data blending
17. Explain about your last project
18. Have you created any data source
19. What is the Best feature in Tableau
20. Have you worked in Tableau.tdsx
21. Tableau Architect
22. Have you worked in Tableau Repository
23. Metrics used in your project
24. Advantages of Tableau
25. What are all charts you have worked
26. How do you optimize the visualization in Tableau
27. What is server
28. What is the Workflow method used in your Organization
29. How long it will take to create a dashboard from scratch
30. Color of Context Filter
31. What is Book mark
32. Escalation in Tableau Repository
33. What is the color of Discrete and Continuous”
Model Resume Download Links
Software Download Links
Check Out Our SQL Compiler!
Greens Technology offers a powerful online SQL Compiler to help you practice and improve your SQL skills. Click the button below to get started.
Job Portals list
- Data Analytics Jobs on Naukri
- Data Analytics Jobs on Indeed
- Data Analytics Jobs on LinkedIn
- Data Analyst Jobs on Shine
- Data Analyst Jobs on Foundit
- Data Analyst Jobs on TimesJobs
- Data Analyst Jobs on Glassdoor
- Data Analyst Jobs on Freshersworld
- Data Analyst Freelance Jobs on Upwork
- Data Analyst Jobs on HerKey
- Data Analyst Jobs on Cutshort
- Data Analyst Jobs on Jobsora
- Data Analyst Jobs on Quikr
- Data Analyst Jobs on Hirist
- Data Analyst Jobs on Snaphunt
- Data Analyst Jobs on WorkIndia
- Data Analyst Jobs on Foundit (Alternate)
- Data Analyst Jobs on Fishbowl
- Data Analyst Jobs on Wellfound
Task 1: Introduction
- Visualize region-wise sales using a pie chart with tooltips showing profit and discounts.
- Represent date-wise sales through a line chart.
- Design a distinctive chart to display sales by category and sub-category.
- Create a treemap using Region and Discount as key metrics.
- Develop a bubble chart showcasing Subcategory and Profit.
- Analyze state-wise sales using a box-and-whisker plot.
- Generate 24 charts utilizing custom metrics from the “Show Me” panel.
Task 2: Level of Detail (LOD)
- Identify the last order date for each product.
- Determine the most recent purchase for each customer.
- Visualize total sales at the sub-category level using Category, Sub-Category, State, and Sales.
- Classify product count based on defined sales ranges (0–1000).
Task 3: Analytics & Quick Table Calculations
- Forecast sales trends for 2021.
- Compare actual sales against a chosen target value.
- Cluster sub-categories based on data trends.
- Create a text-based chart incorporating Region, Segment, Category, Sub-Category, and Sales with row and sub-totals.
- Develop a bar chart to display average sales by Region.
- Calculate cumulative sales for each customer.
- Determine the sales difference between previous and current values at the sub-category level.
Task 4: Dual/Blended/Sync Filters
- Design a single visualization incorporating Sales, Discount, Profit, and Category.
- Compare current-year profit and sales within one chart.
- Implement a context filter for Category and Sub-Category.
- Set up a cascading filter for Category and Sub-Category.
Task 5: Grouping, Sets, Parameters, and Hierarchies
- Identify top-performing products based on Profit and Product.
- Display the top and bottom five sub-categories by sales.
- Enable multiple graphs on a single sheet using metrics such as Profit, Total Sales, and Profit Ratio.
- Implement drill-down functionality for all product-related fields.
- Develop a grouped and combined visualization using a customized approach.
- Create a date parameter using Ship Date to reflect across all charts.
Task 6: Functions
- Show the last date of the current month.
- Calculate remaining days until the year’s end.
- Identify the most recent purchase date for each customer.
- Count total records per sub-category.
- Convert “appliances” to “Appliances” (capitalize first letter).
- Display total sales for each category.
- Count sales per category while excluding duplicates.
- Retrieve the second order date for each customer.
- List all customers whose names begin with “A.”
- Identify customers whose names end with “H.”
- Extract the year from the Order ID.
- Categorize sales into three ranges:
- Above 50,000: Good
- Above 100,000: Very Good
- Above 150,000: Excellent
Task 7: Dashboard Creation
Key Performance Indicators (KPIs):
- Sales
- Profit
- Sales per Customer
- Profit per Product
- Sales Growth Compared to the Previous Year
Dashboard Components:
- Include two filters and a date parameter.
- Incorporate at least six charts:
- Year-over-Year (YOY) Analysis
- Four custom-designed charts
- One tailored visualization
- One map-based chart
- Enable action filters for interactive data analysis.
Weekend Task 01: Custom Charts
- Waterfall Chart
- Donut Chart
- Butterfly Chart
- Pyramid/Funnel Chart
- Histogram Chart
- Heat Map and Treemap using Profit and Sales
Weekend Task 02: Dashboard Development
- Source data from Tableau Public and build a detailed dashboard.
- Apply two filters and a date parameter for dynamic interaction.
Tableau Limitations
- Maximum Rows: Unlimited
- Maximum Columns: 50
- Maximum Table Joins: 32
- Default Join Type: Inner Join (modifiable)
- Blended Data Join: Left Outer Join by default
- Maximum Worksheets: 155
- Maximum Parameters: 155
Power Query
- Efficient data transformation and connectivity.
Data Visualization & Power BI Desktop
- Create dynamic reports and dashboards.
M Query
- Automate and optimize data processing.
Power Query Editor
- Extract, transform, and load (ETL) data efficiently.
Data Modeling
- Build structured relationships for insightful analysis.
DAX Functions
- Perform advanced calculations and aggregations.
Power BI Visuals
- Enhance reports with interactive charts and graphs.
Power BI Service
- Publish, share, and collaborate on reports online.
Report Views
- Customize layouts for better data presentation.
Data View
- Explore raw data in structured format.
Model View
- Manage relationships between multiple datasets.
Transform Data
- Modify and optimize existing data structures.
Add Column
- Create customized columns for analysis.
Transformation Options
- Various tools for reshaping and organizing data.
Data Types
- Supports numeric, text, date, and Boolean formats.
Data Operations
- Perform header adjustments, transpositions, and modifications.
Formatting Options
- Change case, trim, merge, and parse data.
Statistical Functions
- Calculate sum, average, median, and deviations.
Mathematical & Scientific Functions
- Perform standard and advanced calculations.
Standard Calculations
- Execute addition, subtraction, and percentage functions.
Scientific Operations
- Compute power, logarithm, and square root values.
Rounding Functions
- Round up, down, or to the nearest value.
Date & Time Functions
- Extract and manipulate date and time components.
Column Operations
- Create custom, conditional, and indexed columns.
Data Management & Queries
- Manage data connections and refresh data.
Home Functions
- Sort, filter, remove, and group data efficiently.
Merging & Appending Queries
- Merge and append datasets using various joins.
DAX – Data Analytics Expressions
- Perform complex calculations with optimized performance.
Calculated Columns & Measures
- Create memory-efficient calculations and aggregations.
Date & Logical Functions
- Apply conditional logic and date-based calculations.
Text Functions
- Format and manipulate text data effectively.
Time Intelligence Functions
- Analyze trends with YTD, QTD, and MTD calculations.
Information & Aggregate Functions
- Validate data and perform filtering operations.
Power BI Service
- Publish, share, and refresh reports seamlessly.
SQL Tasks – Hands-On Practice
Day 1: Filtering and Sorting Data
- Retrieve names beginning with ‘S’.
- Find names starting with ‘S’ and ending with ‘n’.
- List employees in department 90 whose names start with ‘S’.
- Display employees from departments 10, 20, 50, and 90.
- Retrieve names, salaries, and department IDs outside these departments.
- Find employees with salaries between 5000 and 7000.
- List employees without managers.
- Retrieve all employee records sorted by first name.
- Display department ID and salary, sorted by department (asc) and salary (desc).
- Find employees earning more than $12,000.
- Retrieve last name and department number for employee ID 176.
- Show employees hired between Feb 20, 2003, and May 1, 2005.
- List employees from departments 20 and 50 in alphabetical order.
- Show job titles of employees without managers.
- Display salary and commission details for employees receiving commissions.
Day 2: Aggregate Functions
- Count total employees.
- Calculate the average salary.
- Identify highest and lowest salaries.
- Determine the average salary per department.
- Find departments with more than 5 employees.
- Compute the average salary for those earning above $50,000.
- Calculate total salary expense per department.
- Count employee hires per year, month, and weekday.
- Count employees with the same job title.
- Display max, min, sum, and average salaries.
- Find salary statistics per job type.
- Compute the difference between highest and lowest salaries.
- Count total managers.
Day 3: Analytical vs. Aggregate Functions
- Compute the organization’s average salary.
- Calculate department-wise average salary.
- Show average salary alongside each employee.
- Find cumulative salary per department and company-wide.
- Rank employee salaries within departments.
- Identify the highest and lowest salaries per department.
- Find oldest and newest employees per department.
Day 4: Date Functions
- Retrieve the current date and time.
- Extract year, month, and day from a date.
- Calculate the difference between two dates in days.
- Format dates in SQL Server.
- Add and subtract days from a date.
- Identify the first and last day of the current month.
- Extract the quarter of the year from a date.
- Determine the number of weeks between two dates.
- Compute hours, minutes, and seconds between two timestamps.
Day 5: String Functions
- Extract first names from full names.
- Convert employee names to uppercase.
- Retrieve employees with names starting with ‘J’.
- Concatenate first and last names.
- Format phone numbers with dashes.
- Find employees with specific email domains.
- Identify last names with exactly five characters.
- Extract the domain from email addresses.
- Replace specific characters in strings.
- Reverse characters in last names.
Day 6: Case & Convert Functions
- Indicate whether employees receive commissions.
- Classify employees based on experience levels.
- Categorize employee salaries as Low, Medium, or High.
- Convert hire dates into various formats.
- Use CASE to label employees by job title.
Day 7: Data Definition Language (DDL)
Creating and Modifying Tables
- Create an Employees table with EmployeeId, FirstName, LastName, HireDate, and Salary.
- Add an EmailAddress column to the Employees table.
- Allow NULL values in the Salary column.
- Rename the LastName column to Surname.
Dropping and Renaming Tables
- Remove the Employees table from the database.
- Rename the Employees table to Staff.
Constraints and Indexes
- Apply a unique constraint to the EmailAddress column.
- Establish a foreign key linking Employees and Departments.
- Retrieve a list of all tables in the database.
- Create a Projects table with ID, ProjectName, StartDate, and Budget.
Day 8: Data Manipulation Language (DML) & Transaction Control Language (TCL)
Data Manipulation
- Insert a new employee with EmployeeId 101.
- Update EmployeeId 101’s salary to 80,000.
- Delete EmployeeId 101 from Employees.
- Assign DepartmentId 5 to employees earning above 70,000.
- Insert multiple records into Projects.
- Fetch all Employees and replace NULL values in EmailAddress.
- Set NULL CommissionPCT values to 0.
- Bulk insert into Projects in a single query.
- Delete Projects with StartDate before 2024-03-01.
- Update EmailAddress for employees with LastName ‘Doe’.
Transactions
- Define transactions and their significance in SQL Server.
- Explain the COMMIT statement.
- Describe the ROLLBACK function.
- Discuss SAVEPOINT and its applications.
- Compare COMMIT, ROLLBACK, and SAVE TRANSACTION.
1. What is power query editor?
2. What are the connection present in power bi?
3. What is live connection?
4. What is reference?
5. What is duplicate?
6. What is append and merge?
7. What are the types of joins in power bi?
8. What is query folding?
9. What is m language?
10. What is query dependency?
11. What are the transformation will do in power query editor?
12. What is dimension and measure?
13. What is pivot and unpivot?
14. What is groupbyfunction in power query editor?
15. What is grouping and binning in power bi?
16. What are the most common data shaping technique?
17. What is data modelling
18. What is dimension tableand fact table and also difference?
19. What is star schema, snow flake schema?
20. What is cardinality or relationship?
21. How many cardinality are there in power bi?
22. What relationship?
23. How to implement relationship?
24. How to implement many to many relationship?
25. What bidirectional filter?
26. How many active relationship we can create at a time during modelling?
27. What is report view?
28. What are the refresh in power bi?
29. What is incremental refresh
30. What is full refresh?
31. How to implementation of incremental refresh?
32. What is manage relationship? DATA VISUALISATION QUESTIONS:
33. What is dax functions?
34. What is rls and implementation
35. Types of rls
36. What is new column, new measure,new table?
37. What calculated column, calculated measure?
38. Diff sum between sumx?
39. Diff between row context and filter context?
40. Difff calculateand calculate table?
41. Diff all, all except, all select & real time use case?
42. What are the dax functions you have used?
43. What are the functional groups in dax?
44. What is time intelligence function ?
45. How to connect relation in dax?
46. What is cumulative dax functions
47. Types of filter
48. What is slicer and sync slicer?
49. What is drill down and drill through
50. Diff between filter and slicer
51. What is book mark?
52. What is book mark action?
53. What is custom visuals?
54. Explain what types charts have you used in your projects?
55. Parameter (query parameter, visual parameter)
56. What is performance tuning?
57. What conditional formatting
58. How you testing the reports?
59. Difference between reports and dashboard?
60. How you will get requirement or brd
61. Limitation of import method?
62. Maximum data size used in power bi
63. What is summarize , summarizex?
64. What is iteration function?
65. What is power automate?
66. What are the three fundamental concepts of dax
67. Performance tuning (dax,datamodelling,visual,query editor)
POWER BI SERVICE QUESTIONS:
68. What is alert, subscription
69. What is power bi service?
70. What is gateway connectios and types?
71. What is workspace?
72. What is data flow?
73. What is ccid pipeline?
74. What is switch function?
75. What is subscription and alert?
76. Will you able create multiple workspace?
77. What are the tabs available in power service?
78. What is scd?
79. What is paginated report?
80. How to configure schedule refresh in power bi service? GENERAL QUESTIONS:
81. What is power bi?
82. Difference between power bi and tableau?
83. Why you prefering power bi?
84. Power bi latest version and updates
85. What are the views present in power bi
86. How to get data from data source?
87. What is power q/a?
88. What is power map?
89. What are the components present in power bi?
90. What is ssbi?
91. What are the database have you used?
92. Advantange and limitations of power bi?
93. What data sources can power bi connect to?
94. Where is data stored in power bi?
Data warehousing questions
1. What is data warehousing?
2. Olap vs oltp
3. Star schema and snowflake schema
SQL interview question
1. What are the available data types in SQL?
2. What are the operators we have in SQL?
3. What are the case manipulation functions?
4. What are the character/string manipulation functions?
5. What are the analytical functions in SQL,explain its types?
6. What are the aggregate functions in SQL,explain its types?
7. What are the null functions in SQL and explain its types?
8. What are the date functions in SQL and explain its types?
9. What is ddl, dml & tcl, dql commands?
10. What are the joins available in SQL?
11. What is a view & materialized view?
12. What are the sub queries in SQL?
13. What are the set operations?
14. What are the pseudo columns?
15. What is a like operator?
16. What are the constraints
SQL difference questions
1. What is the difference between where and having?
2. What is the difference between delete, drop & truncate?
3. What is the difference between union and unionall?
4. What is the difference between nvl, nvl2 & colasece?
5. What is the difference b/w primary key & foreign key?
6. What is the differences between in and equall to?
7. What is the difference between case and decode?
8. What is the difference between and and or?
SQL queries
1. Write query to find max salary from employee table?
2. Write query to find 2nd max salary from employee table?
3. Write query to find nth max salary from employee table?
4. Write query to find max salary department wise?
5. Write query to find nth max salary department wise?
6. Write query to find employee & manager name?
7. Write query to how to find and delete the duplicates?
1. What is Tableau, Why it is used for
2. What is data visualization
3. What is Workbook, Worksheet, Dashboard and Story
4. What are the data types in Tableau
5. What is Dimensions and Measures
6. What is Discrete and Continuous
7. What is Aggregation and Disaggregation of data
8. Types of file Extensions in Tableau
9. What is Group and Combine
10. What is Dynamic Group
11. What is Set and Parameter
12. What is Hierarchy and how you will create
13. What are the types of connection in Tableau
14. Types of Filters in Tableau
15. What is Context filter and Cascading Filter
16. Order of Execution of filterM
17. What is Dual Axis, Blended Axis & Synchronizing Axis
18. What are the Analytical Functions in Tableau
19. What are the Dashboard Actions present in Tableau
20. What are the Number Functions in Tableau
21. What are the Aggregate Functions in Tableau
22. What are the logical Functions in Tableau
23. What are the String Functions in Tableau
24. What are the Table calculation Function in Tableau
25. What are the Date Functions in Tableau
26. What is Data Blending
27. What is Data Joining
28. What is Relationship
29. What is LOD and its types
30. What is Bins
31. What are the types of Joins
32. What is Calculated Field
33. What is Quick Table Calculation and types
34. What are Worksheet Marks
35. What are the Dashboard Actions
36. What is Tiled and Floating
37. How to increase Performance in Tableau/Performance Improvement
38. How to overcome unknown location in Tableau
39. What is Published Data Source
40. What is Embedded Data Source
41. What is KPI and What are the KPI’s used in your Project
42. What are the Rank Functions in Tableau
43. How is Context Filter different from other filter? What is the disadvantage of context filter
44. What is Tableau Server
45. What is User filter and Row level Security
46. What is Incremental Refresh
47. What is Tableau Data Engine/hyper
48. Roles available in Tableau Server
49. Limitations of Context Filter
50. What is Data Extract in Tableau Server
51. What is Alert and What is Subscription
52. Performance tuning in Tableau
53. How performance testing done in Tableau
54. What is Normalization and Denormalization
55. What is Granularity
56. What is Boxplot Chart
57. What is Scatter Chart
58. What is Histogram Chart
59. What is Dendogram Chart
60. What is Waterfall Chart
61. What is Referential Integrity
62. What is cardinality
63. What is set and where you have used
64. What is Primary data and Secondary data
65. How will you Change Primary and Secondary Data Source
Difference between Questions
1. Difference b/w twb and twbx
2. Difference b/w Group and Combine
3. Difference b/w Set and Parameter
4. Difference b/w set and Group
5. Difference b/w Heat map and Tree map
6. Difference b/w Context filter and Cascading filter
7. Difference b/w Dual Axis and Blended Axis
8. Difference b/w Ceiling and Floor
9. Difference b/w Ifnull, Isnull and Zn
10. Difference b/w contains and endswith
11. Difference b/w ltrim and rtrim
12. Difference b/w first and last
13. Difference b/w Rank and Rank_dence
14. Difference b/w Today and Now
15. Difference b/w Data blending and Data Joining
16. Difference b/w live and Extract Connection
17. Difference b/w Alert and Subscription
18. Difference b/w Filters and Parameter
Scenario Based Questions
1. How to display top5 and bottom5 sales
2. What are the KPI’s used in your Project
3. What is the version you are using
4. What are the unique features in every version of Tableau
5. How to remove ‘All’ in Show Filters
6. How to display * in measures
7. How many data sources you can blend(5)
8. How many tables you can Join(32)
9. How many columns we can extend in Tableau(50) Default is (16)
10. There are three customer in the super store data set. What percent of the total profits is associated with the corporate segment?
Output:Consumer-46.83%
Corporate-32.12%
Home Office-21.05%
11. How to remove ‘Abc’ from the table
12. What is Empty Extract
13. What Visualization will you suggest for the following Scenarios
i) To Show aggregated sales totals across a range of product categories(Tree map)
ii) To show the duration of events or activities(Gantt Chart)
iii) To show quarter wise profit growth(Waterfall)
14. What are the Special Chart you used in your Project
15. Can we use group in calculated field
16. There is a sale record in which dates are from Monday to Sunday. How can we take records from Wednesday to Sunday
17. Top and bottom value how you will achieve
18. Which chart will you prefer for time line scenario
19. How will you Extract data from server
20. Have you used forecast in your project
21. What is the custom SQL you used in your project
22. How will you neglect null values
23. How to Change Start Date of week and Fiscal Date in the Data
24. How will you find Second Order Date
25. How to display Top20-30
Other Questions
1. What is the Difference Between Tableau and Other BI tools
2. What are the Tableau Products
3. What is ETL and What are the ETL toll you are using
4. For what Tableau Server is used For
5. Do parameter contains a Drop down list
6. Drawbacks of Tableau
7. Drawbacks of data blending
8. What are the documents you will attached to client during deployment
9. What is the default aggregation function
10. What is the default chart
11. How can you embed a webpage in a dashboard
12. How can you Schedule a workbook in Tableau after publishing it
13. What are difficulties faces/difficult Scenarios
14. What is the data source you are using in your project
15. What is data warehousing
16. Have you used data blending
17. Explain about your last project
18. Have you created any data source
19. What is the Best feature in Tableau
20. Have you worked in Tableau.tdsx
21. Tableau Architect
22. Have you worked in Tableau Repository
23. Metrics used in your project
24. Advantages of Tableau
25. What are all charts you have worked
26. How do you optimize the visualization in Tableau
27. What is server
28. What is the Workflow method used in your Organization
29. How long it will take to create a dashboard from scratch
30. Color of Context Filter
31. What is Book mark
32. Escalation in Tableau Repository
33. What is the color of Discrete and Continuous”
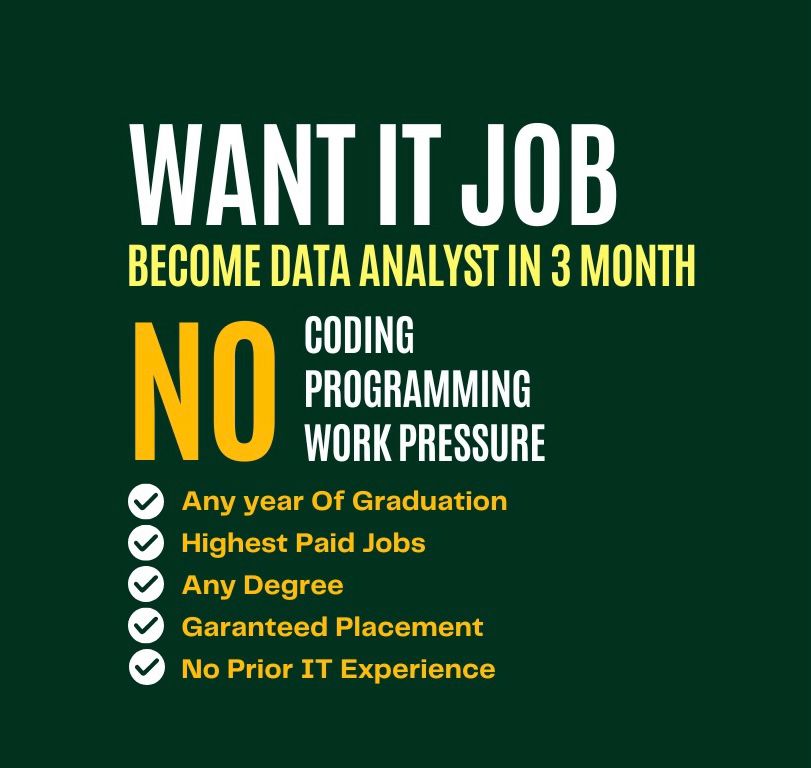
Why Data Analytics Training?
Data analytics is a high-demand skill that helps businesses make data-driven decisions. With structured training, you gain expertise in data visualization, SQL, Python, and business intelligence tools. This course enhances career opportunities, offering hands-on experience and placement support to secure top analytics roles.
Google Reviews
-
Velachery Chennai
0
★★★★★ 5/5
2,394 Ratings
“WITH TRAINER Mr. VELUMANI in Velachery Branch Very Good
Experience and Gain the knowledge in Tableau, power bi,sql and very good trainer”
★★★★★ 5/5
Akshuu
“WITH trainer Mr. VELUMANI in Velachery Branch i am really delighted about with my data analytics tools(python,sql, power bi, tableau) Training course and i am surprised to see the depth of your knowledge”
★★★★★ 5/5
Janani Priya
“Greens technologies Velachery is ah best training institute for professional courses like data analytics, app development and web development, i am doing here data analytics course thanks to trainers, theirs teching and practical session are good. I recommend freshers and people who are looking for carrier change, greens technologies Velachery is best place for that.”
★★★★★ 5/5
Harish Harish
“I had a valuable learning experience with the DATA ANALYTICS TEAM – DAS
WITH TRAINER Mr. VELUMANI in Velachery Branch This opportunity allowed me to enhance my skills in Tableau, SQL, Power BI, and Python, providing hands-on experience in data analytics.”
Akshaya Malu
★★★★★ 5/5
Our Branches
Omr
Adyar
Tambaram
Navalur
Porur
Perumbakkam
Anna Nagar
Velachery
Vadapalani
Perungudi
Avadi
Mugalivakkam
Mount Road
T Nagar
Ambattur
FAQ
Who can enroll in this Data Analytics training?
Anyone interested in data analytics, including fresh graduates, working professionals, and career switchers.
Do I need prior coding experience to join?
No, our training covers everything from basics to advanced concepts, making it beginner-friendly.
What tools and technologies will I learn?
You’ll gain expertise in SQL, Python, Excel, Power BI, and other industry-standard analytics tools.
Is this course available online or offline?
We offer both online and classroom training options for flexible learning.
Will I get hands-on project experience?
Yes, you’ll work on real-world projects and case studies to build practical skills.
Anyone interested in data analytics, including fresh graduates, working professionals, and career switchers.
No, our training covers everything from basics to advanced concepts, making it beginner-friendly.
You’ll gain expertise in SQL, Python, Excel, Power BI, and other industry-standard analytics tools.
We offer both online and classroom training options for flexible learning.
Yes, you’ll work on real-world projects and case studies to build practical skills.
Do you provide certification after completion?
Yes, you’ll receive a course completion certificate along with guidance for industry-recognized certifications.
Is placement assistance included in the program?
Yes, we offer resume building, interview preparation, and job placement support.
What is the duration of the course?
The duration varies based on the learning mode, typically ranging from 2 to 4 months.
What career opportunities are available after the course?
You can pursue roles like Data Analyst, Business Analyst, or BI Analyst in top companies.
How do I enroll and what is the course fee?
You can contact us through our website or visit our center for enrollment details and fee structure.
Yes, you’ll receive a course completion certificate along with guidance for industry-recognized certifications.
Yes, we offer resume building, interview preparation, and job placement support.
The duration varies based on the learning mode, typically ranging from 2 to 4 months.
You can pursue roles like Data Analyst, Business Analyst, or BI Analyst in top companies.
You can contact us through our website or visit our center for enrollment details and fee structure.
Upcoming Batch Dates
Chennai
91 9677273272
Chennai
91 9677273272